
In this article, I’ll briefly discuss a simple analysis procedure to evaluate bonded structures using FEA. This procedure can be extended to the finite element analysis of more complex structures involving bonded joints.
Adhesive bonded joints are an excellent alternative to mechanical fasteners and in some cases, it might be the only solution. Adhesive joints offer high strength to weight ratio, in particular for joints in shear. Here are some pros and cons:
Pros:
- Weight Reduction. High strength to weight ratio.
- Reduced number of production parts, design simplification.
- The need for milling, machining & forming operations is reduced.
- Large area bonds can be made with a minimum workforce without special skills.
- Roughly three times the shearing force of riveted or spot-welded joints.
- Used as a seal and or corrosion preventer when joining incompatible adherents.
- Excellent electrical & thermal insulation.
- Superior fatigue resistance. Three times that of riveted & spot-welded joints.
- The flexibility of adhesives allows for the variation in CTE’s when joining dissimilar materials.
- Stress concentration as in mechanical joints is eliminated.
Cons:
- Permanent connection.
- Degradation of adhesive properties after exposure to certain environments.
- Load transfer is limited due to the low shear strengths of both adhesive and composite laminate.
- High thermal strains can exist in bonded regions due to the high cure temperature of adhesives.
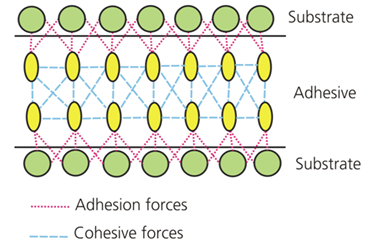
In this article, I’ll briefly discuss a simple analysis procedure to evaluate bonded structures using FEA. When two plates (substrates) are bonded by an adhesive, we have essentially two types of forces at play:
- Adhesion: This is the force of connection between adhesive and substrate. Adhesion keeps the adhesive bonded to the substrate.
- Cohesion: This is the force of connection within the adhesive itself. It is basically the material strength of the adhesive material after it has cured.
Bonded Joint fails in the following modes of failure:
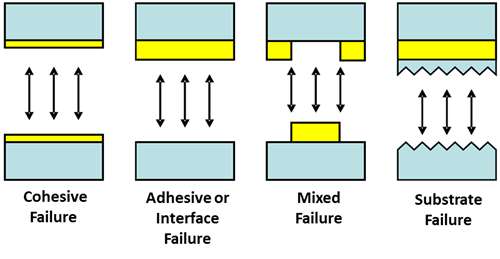
The cohesive failure mode is essentially failure (due to fracture or yield) of the adhesive material. The adhesive failure is basically the separation of adhesive from the substrate leaving a clean surface. Next, we have a mixed failure mode which can be cohesive and adhesive failure modes combined. Finally, the substrate itself can fail under load. In analyzing a bonded joint we make the following assumption:
- Substrate failure mode can be avoided by redesigning the substrate structure.
- Adhesive and mixed failure modes can be avoided by carefully preparing the surface to be bonded by means of priming and or other surface preparation guidelines provided by the adhesive supplier.
If we can ensure that substrate and adhesive failure modes don’t happen then we are able to fully leverage adhesive strength properties and design for cohesive failure. Furthermore, cohesive failure can happen due to the following types of loads:
- Peeling Load: This type of load is applied normal to the adhesive bond Line or adhesion surface and thereby tends to separate the two plates apart.
- Shearing Load: This type of load tends to slide the plates parallel to each other causing shear of adhesive material.
The typical peel strength of a bonded connection using epoxy adhesive is ~ 60 psi compared to ~ 2000 psi in shear. Therefore adhesively bonded joints are not ideal for tension connections which can cause peeling to happen. Bolts are ideal for tension joints whereas bonded joints work best in connections in shear loading.
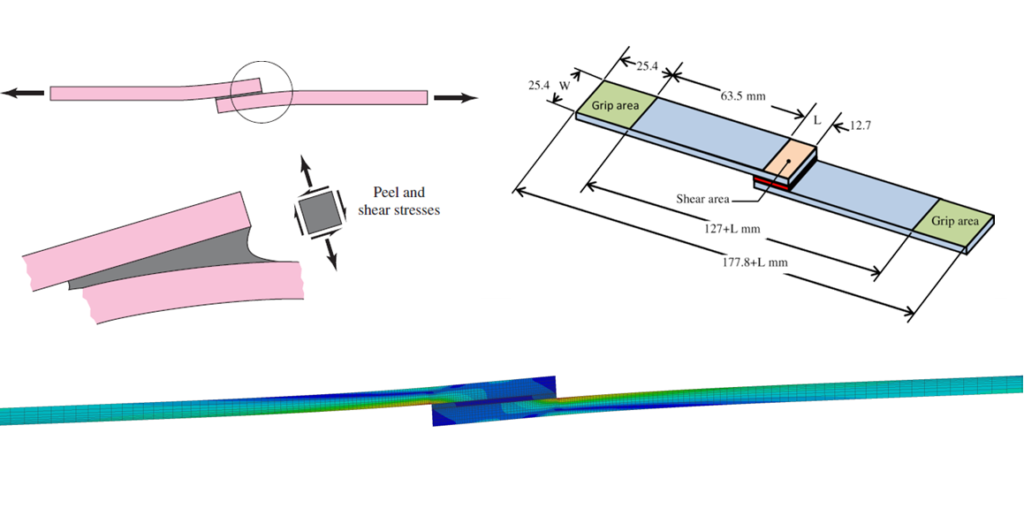
Shear Strength Testing of Adhesive Bonded Metal Specimens – ASTM D 1002
Adhesive shear testing of the bonded joints is carried out by means of a lap joint test specimen shown below. The dimensions shown are as per the ASTM D 1002 standards, where the dimension ‘L’ is 0.5 in (12.7 mm). This gives a bonded area of 0.5 square inch.
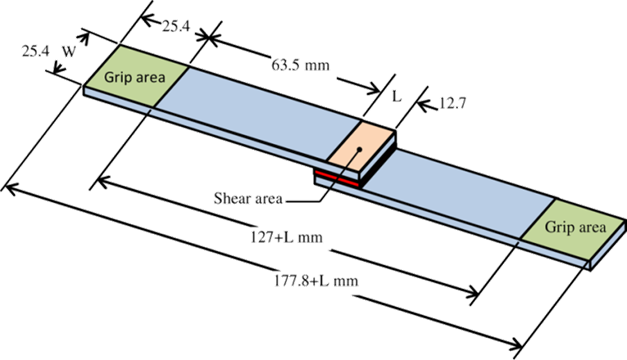
Test Specimen Geometry for ASTM D 1002-94 Test
This lap joint specimen is loaded in a mechanical testing machine where it is held in place by the grip area shown. The test apparatus and load vs extension charts of various tests conducted on the mechanical testing machines are shown below.
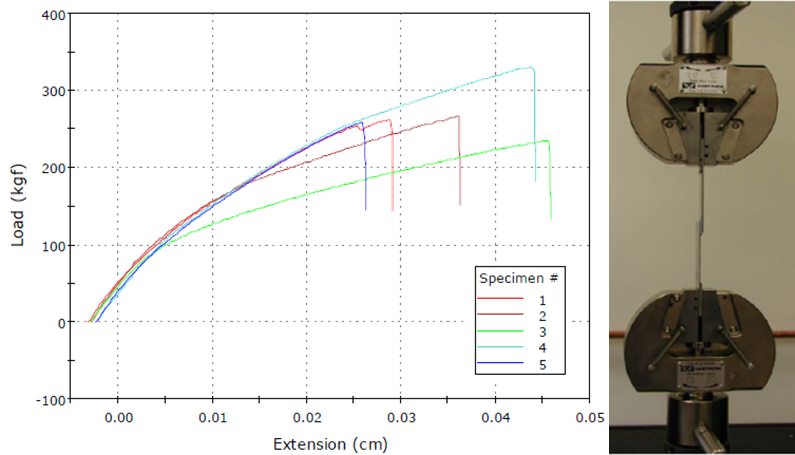
ASTM bonded epoxy joint test results and test apparatus.
Typical epoxy adhesive tests show failure load around 250-350 kgf (551-772 lbf). The shear strength of the joint can be calculated by dividing this force by the lap joint area of 0.5 sq in. This amounts to the shear strength of the above-tested specimens in the range of 1102 – 1544 psi.
Finite Element Analysis (FEA) Model of ASTM D 1002 Standard Shear lap joint
Although physical testing is important, it sometimes doesn’t provide all the details of a physical phenomenon. Therefore, to understand the mechanism of bonded joint failure, I developed a 2D, plane strain finite element model of ASTM standard test joint shown below:
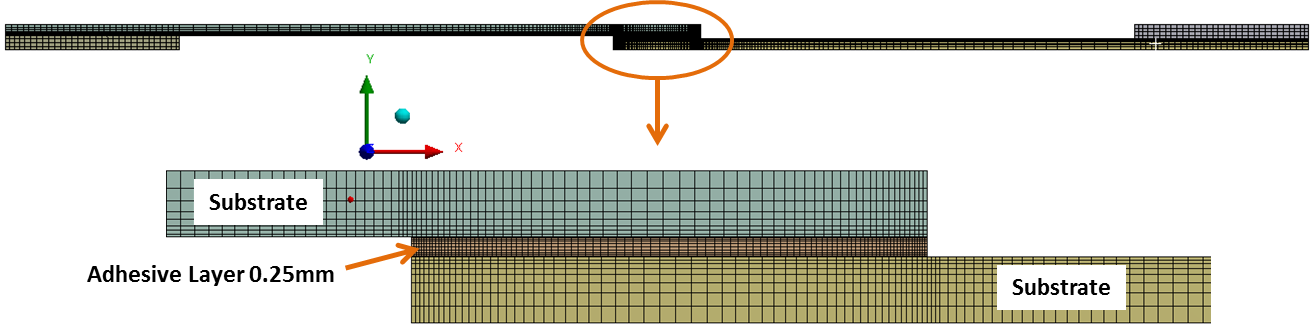
2D plane strain finite element model of ASTM D 1002-94 bonded joint testing.
The adhesive layer material is Araldite Epoxy AW119 and layer thickness is assumed to be 0.25 mm. The substrate material is Aluminum alloy. To model this, a bilinear material model was used having the following properties: E = 71e3 MPa, yield strength = 280 MPa, Tangent Modulus = 280 MPa.
In the FE model, one of the grips ends is fixed while the other end is pulled similar to how it would be held in a mechanical testing machine.
Bonded Joint Cohesion Failure Criterion (FEA)
In order to do a simple bonded joint analysis, we need a failure criterion. The Von Mises yield criterion is commonly used in plasticity models for a wide range of materials. It is a good first approximation for metals as well as polymers. So in mathematical terms:
“If, Von Mises stress is equal to the tensile strength of epoxy adhesive (indicated by the red star in the chart below), anywhere in the adhesive material, then cohesive failure has initiated”
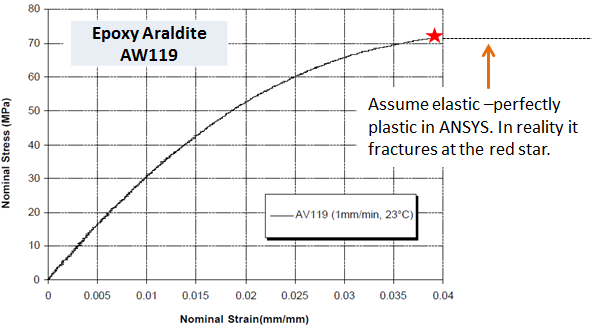
Adhesive Stress-Strain Data for FEA
In the analysis, the adhesive material is defined as a multi-linear material model with a plastic region starting from 30 MPa. If we observe the chart above, the stress-strain curve is almost linear up to 30 MPa. At around 71 MPa, this material fractures, indicated by a red star. In the analysis model, it is assumed that beyond this point, the multi-linear curve becomes a straight line. So basically, the FE material model of adhesive will become an elastic-perfectly model beyond the fracture point. Therefore, failure will initiate when the VM stress equals fracture stress of ~71 MPa anywhere in the adhesive layer.
FEA Results
As the force is applied, VM stress in the adhesive layer is tracked and shown in the following chart. Note that the chart is plotted against force/length since it a 2D plane strain model.
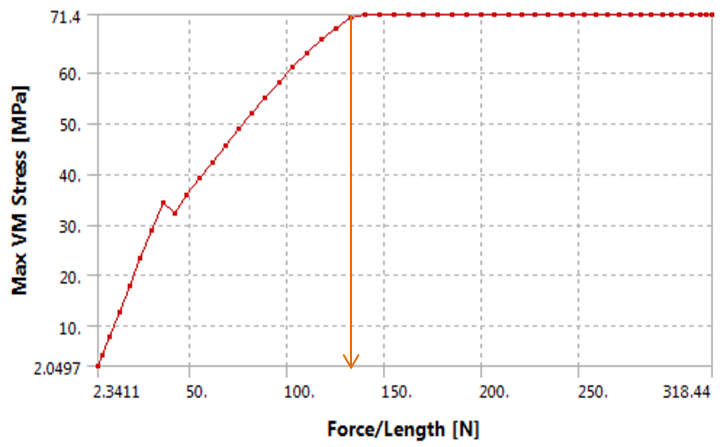
Von Mises Stress vs Force/Length from FEA.
According to the chart above, VM stress flattens at ~71 MPa corresponding to force/length of 132 N. This implies a failure of Araldite AW119 epoxy layer or rather initiation of failure as we know from the stress-strain plot. It is of interest to see where this failure initiates by looking at the following contour plot of VM stress of adhesive layer.
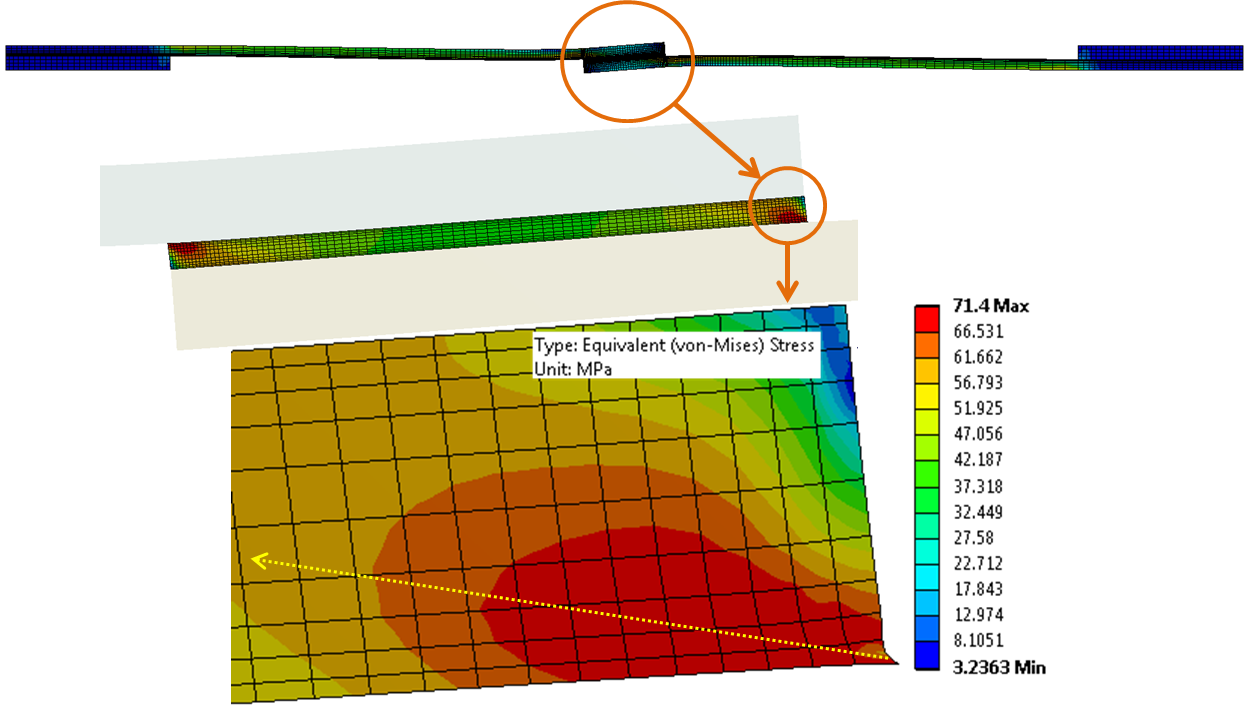
VM stress contour plot of adhesive layer after initiation of fracture. The arrow shows the approximate direction of the fracture line.
The peak stress initiates exactly at the bottom right node (or corner) and grows in the direction of the arrow. I added the arrow to show approximately the fracture line. Due to the symmetry of load and geometry, simultaneous failure will initiate in the top left corner and progress in the opposite direction.
At the start of failure, the force/length = 132 N/mm. The total force at failure is 132 N/mm * 25.4 mm = 3.353 KN or 754 lbf. The shear strength is calculated by dividing this force by the bonded area i.e. 754/0.5 = 1508 psi. This is in the ballpark of what we typically get in terms of shear strength of epoxies in the ASTM test.
We just created our virtual experiment of a bonded connection. FE analysis provides additional information such as stress distribution in the adhesive layer as well as peel stress and shear stress across the bond lines. In my model, I define the bond line as a straight line passing through the middle of the adhesive layer. The peel stress is the normal stress along the bond line or in other words stresses perpendicular to the adhesive layer. The shear stress distribution along the bond line is also very important to understand. Both peel and shear stress along the bond line are shown below.
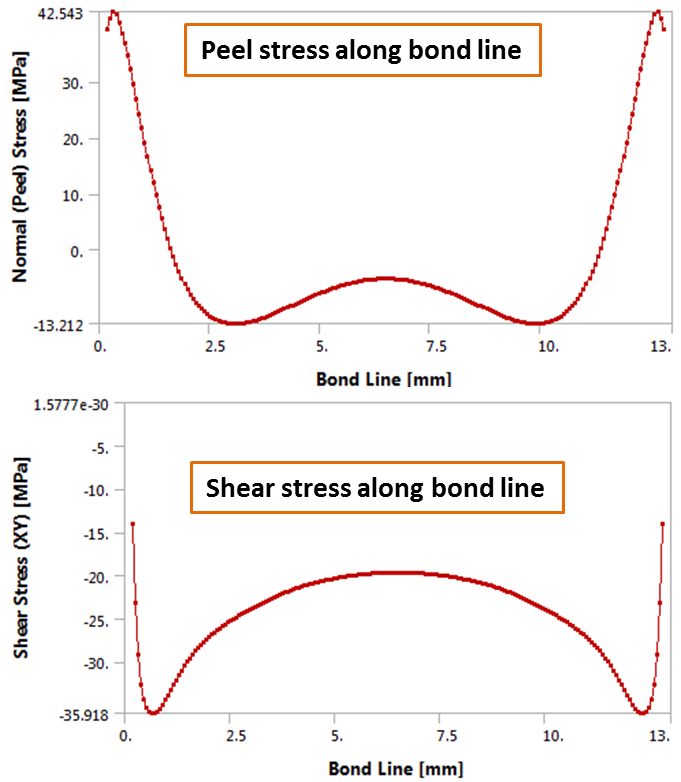
Peel and shear stress along the adhesive bond line.
A problem with a single lap joint is that, close to failure, the bonded plates (substrates) begin to bend. It is possible that instead of cohesive failure, we may get substrate failure. In order to test this, we can look at stress in aluminum plates at the moment of initiation of adhesive failure (shown below). Note that max stress in aluminum of around 274 MPa comes close to its yield strength of 280 MPa. If we had a stronger adhesive, substrate failure would have occurred first.
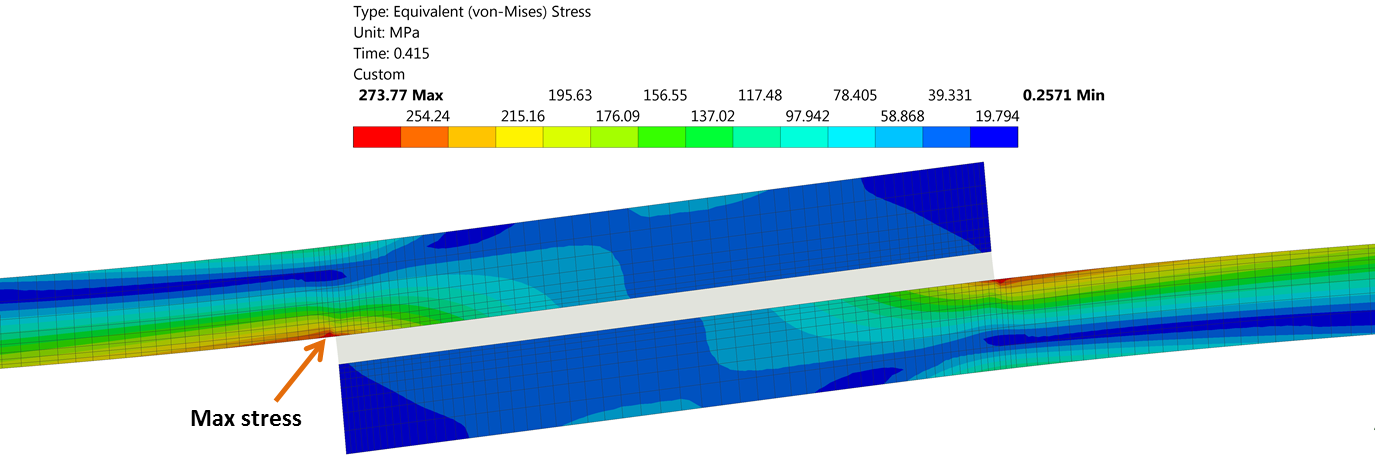
VM stress in aluminum plates at the moment of initiation of failure in the adhesive layer.
If we have a single lap joint application, a single lap joint test makes sense since it will provide a complete picture of any failure mode: cohesive or substrate. Also, in most practical applications, single lap joints are very common. However, if we are primarily interested in the strength of a given adhesive, I suggest doing double lap joint testing as this will eliminate the bending of substrates while providing a true measure of adhesive shear strength.
Conclusions
In this article, I tried to see how we can replicate a physical test by doing a ‘virtual’ FE test. The methodology used here can be applied to more complex structures involving many bonded joints such as airframes, automotive bodies, etc. In the future, I will show how this is done. In the meantime, let me know if you have any questions or suggestions. Please feel free to comment below. If you need a pdf of this article, please email me at zaeem@endeavos.com

8 Comments
To clarify, the properties of the epoxy used in the simulation are generated from a tensile test?
Yes, that is correct
To clarify, the properties of the epoxy used in simulation are generated from a tensile test?
That is correct!
Thank you very much for this article!! Finally something clear about adhesive bonded joints!
Could the strain energy or strain energy density also serve as a failure criterion instead of the Von Mises yield criterion?
Hi Adrien,
Thanks for liking this article. I am currently studying this subject in more detail. I’ll do a follow-up article to explore various failure criteria in bonded joints as well as modeling techniques. If you have any literature on this subject, please do share it with me. I’ll greatly appreciate it.
Thanks,
Zaeem
Hi Zaeem, here’s a good overview paper https://www.sciencedirect.com/science/article/abs/pii/S0143749611000169
Hello,
Thanks for the nice article. Is it possible to share the model ?