
GE global research center located in upstate New York contacted Endeavos Innovations to analyze a sub-assembly of a test rig. The interest was to determine if the critical part of this sub-assembly will survive a combination of thermal and pressure loads.
Endeavos Innovations used the finite element method involving the use of non-linear material models and multi-load step analysis to determine safe operation limits and prevent catastrophic failure.
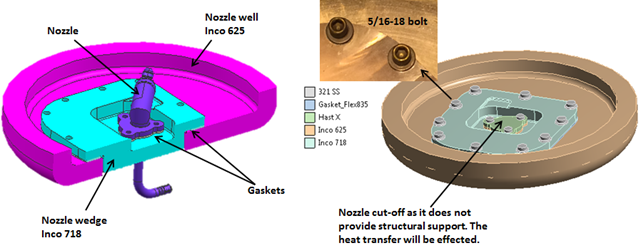
Figure 1: CAD model showing various components in the subassembly
Finite Element Model Development
The sub-assembly solid mode was truncated from the overall sub-assembly such that the model boundary was sufficiently away from regions of critical stress (around the bolts) as shown in Figure 1. Further simplification was achieved by cutting off part of the nozzle as its contribution to mechanical stress was deemed negligible. Truncation of the nozzle did remove material which could affect thermal load distribution, albeit in a small region but made the model more conservative. In our experience, these pre-FEA simplifications contribute significantly in reducing computation time with very little loss in result accuracy, esp. if multiple runs need to be performed.
FE Mesh & Loads
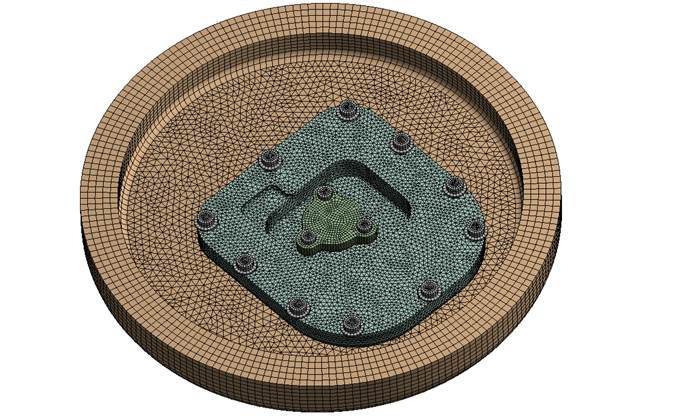
The model mesh is shown in Figure 2. Mesh size was optimized in a few analysis runs to achieve sufficient convergence with acceptable computation time. Further computational efficiency is achieved using hexahedral mesh wherever possible.
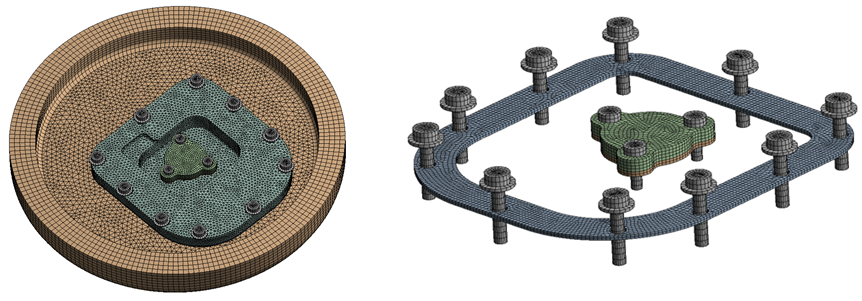
Figure 2: Finite Element Model Mesh
The loads were applied in multiple steps. In the first load step, the bolt preload load is applied which simulates the pre-stress of assembly. Next, the temperature and pressure loads are applied as shown in Figure 3.
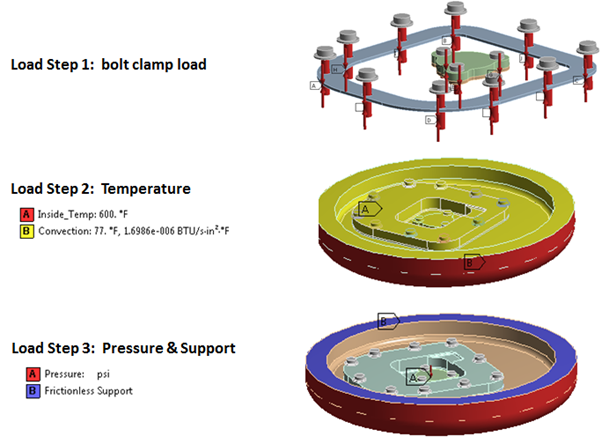
Figure 3: Multiple Load steps applied in a sequence that represents real-world loading.
Material Models
Due to high temperature and pressure loads, non-linear material models were used in the simulation. Temperature affects not only the yield strength but also thermal conductivity, young’s modulus, and coefficient of thermal expansion as shown in Figure 4. Additionally, the gasket material model was used for the two gaskets.
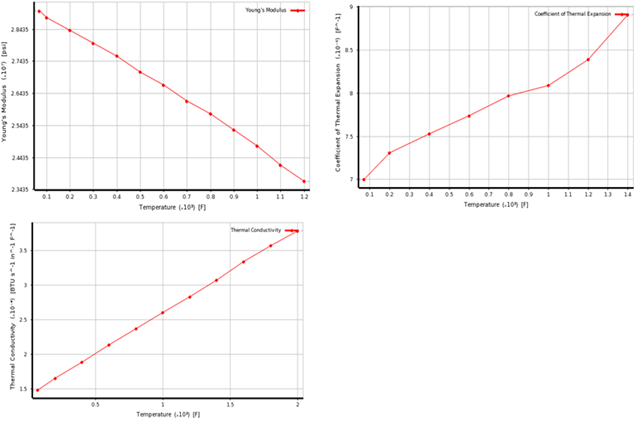
Figure 4: Variation of material and thermal properties with temperature for Inco 718
Results and Conclusions
The steady-state thermal analysis was conducted initially. The contour map of temperature is shown in Figure 5. The wireframe in Figure 6 shows original un-deformed assembly components before loading, whereas, the deformed contour map shows actual deformation scaled up several times. The direction of expansion due to temperature is indicated by the blue arrows.
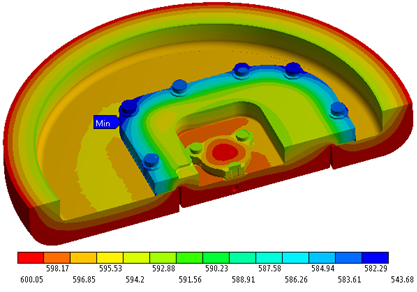
Figure 5: Temperature distribution in degree F as a result of steady-state thermal analysis.
Each component of this sub-assembly including bolts was investigated for peak stress as shown in Figure 7 and Figure 8 respectively. Peak stress locations were further investigated for real stress vs singularities due to sharp corners.
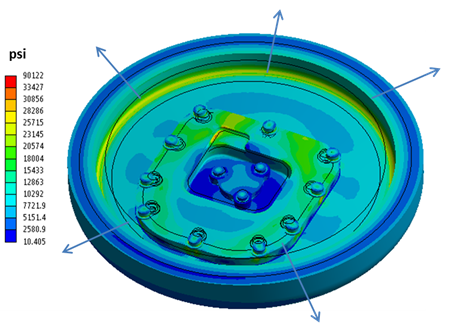
Figure 6: Von Mises stress distribution after pressure load is applied. Blue arrows show expansion due to temperature.
Another concern for the client was gasket leakage under peak load. This was investigated by analyzing contact status, gasket pressure, and force on the gasket during all load steps. As shown in Figure 9, the contact status remains “sticking” along with positive gasket force and pressure. Based on this analysis, it was concluded that gas leakage under peak loading conditions is not possible and nozzle sub-assembly was cleared for operation.
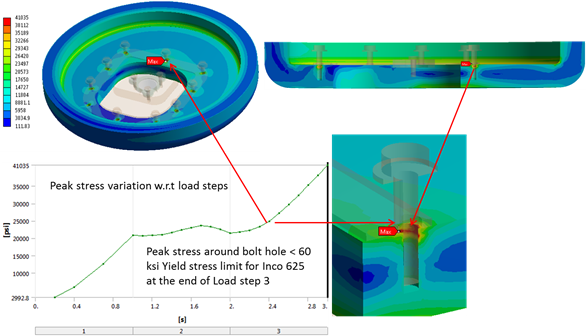
Figure 7: Peak stress variation around bolt hole
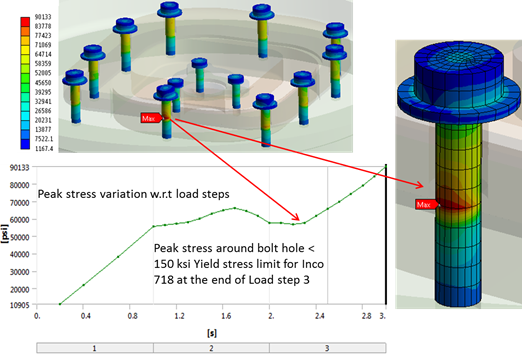
Figure 8: Peak stress variation on the bolt shank
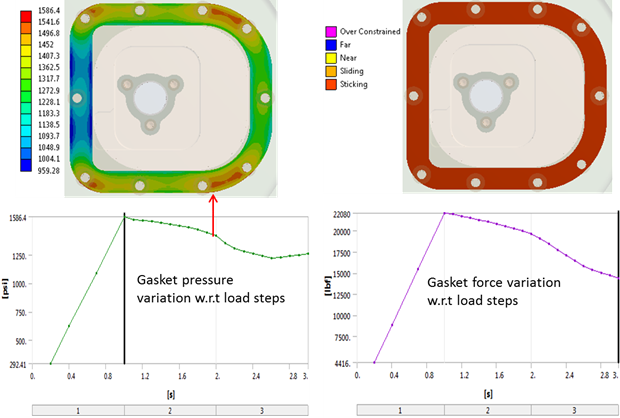
Figure 9: Gasket leakage analysis based on contact status and pressure.