
Previously, I wrote a blog describing in detail the finite element modeling of a single lap bonded joint that corresponds to the ASTM D1002 test specimen. In this article, I’ll show a comparison of that FE model with analytical models of bonded joints. Additionally, I’ll show the effect of varying key parameters such as bond thickness, adhesive ductility and edge fillets on the bond strength. The single lap joint geometry is shown in Figure 1. Aluminum alloy is used as substrate with Araldite Epoxy AV119 as the adhesive.
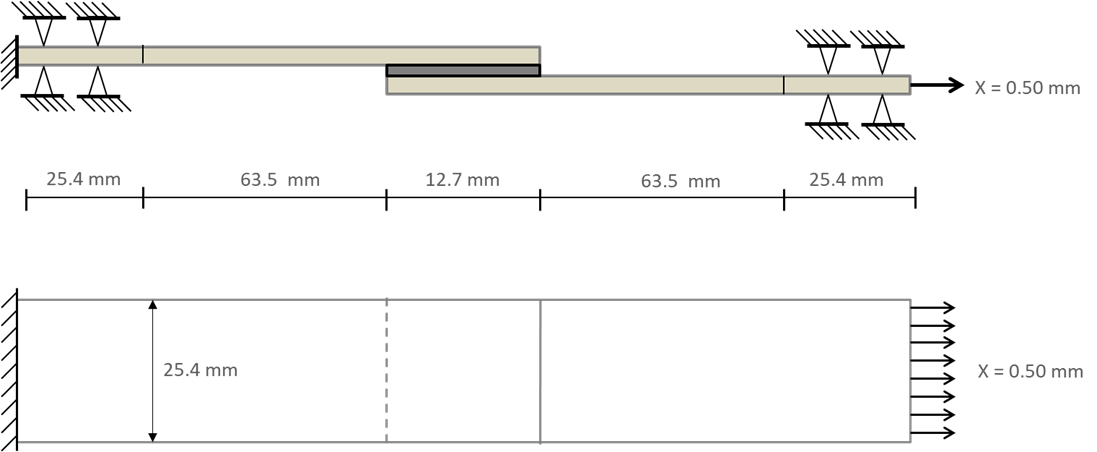
Figure 1: Description of Single Lap Joint model used for the finite element analyses according to the ASTM D1002
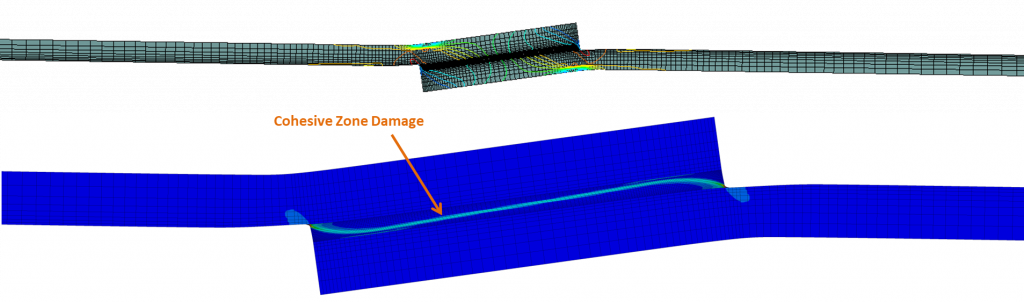
As mentioned in the previous blog, our bonded joint failure criteria is based on adhesive failure, i.e., if the computed adhesive Von Mises stress approaches the adhesive tensile stress limit, then cohesive failure is initiated. In the analysis, the adhesive material is defined as a multi-linear material model with a plastic region starting from 30 MPa as shown in Fig 2. If we observe the chart above, the stress-strain curve is almost linear up to 30 MPa. At around 71 MPa, this material fractures, indicated by a red star. In the analysis model, it is assumed that beyond this point, the multi-linear curve becomes a straight line. So basically, the FE material model of adhesive will become an elastic-perfectly model beyond the fracture point. Therefore, failure will initiate when the VM stress equals fracture stress of ~71 MPa anywhere in the adhesive layer.
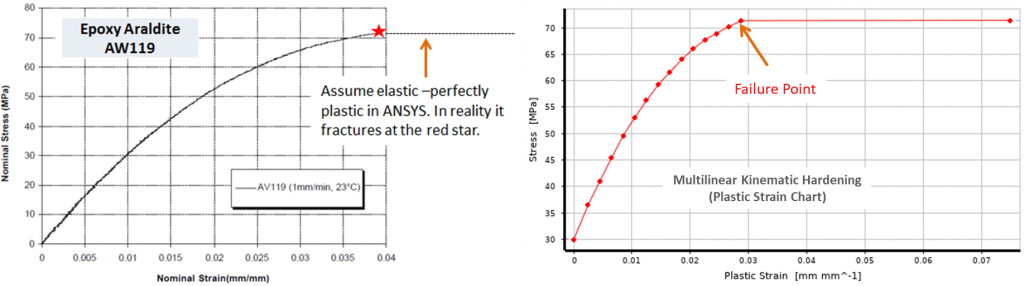
Figure 2: Multilinear material model used for the finite element analyses.
Comparison with Analytical Model
Figure 3 shows a comparison of peel stress distribution along the center line of bonding region between analytical Goland & Reissner model and FE model just before failure. In this particular case, at failure, the applied load is 1905 N (Unit load, F/L=75 N/mm) and thickness of bonding is 0.50 mm. The FEA results shows good agreement with analytical model of Goland and Reissner for calculating peel stress distribution along the bond line. The shear stress distribution computed using FEA also matches well with Goland and Reissner model but not with Volkersen model.
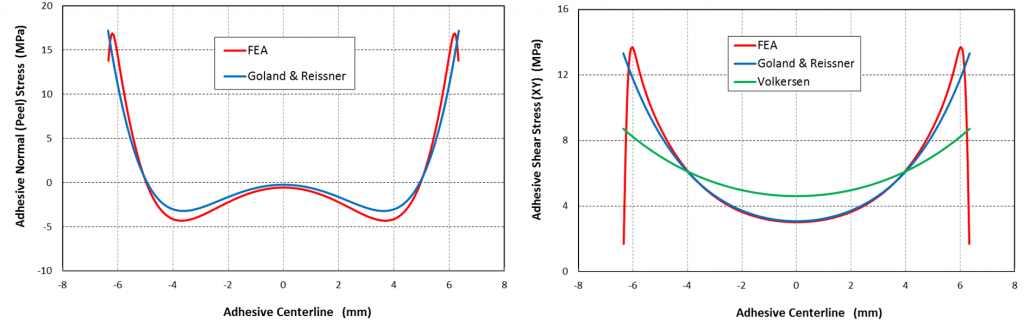
Figure 3: Comparison of FE model of a single lap bonded joint with analytical models of Goland & Reissner and Volkersen. Applied load is 1905 N (Unit load, F/L=75 N/mm) and thickness of bonding is 0.50 mm.
Effect of Bond or Adhesive Thickness
The baseline bond thickness is set to 0.50 mm while thickness is varied from 0.20 to 0.80 mm to study the effect of the adhesive bonding thickness. The results are shown in figure 4. Both Peel and shear stress peaks forming around the ends of the bond line reduce with increasing adhesive thickness but go up in the middle of the bond line.
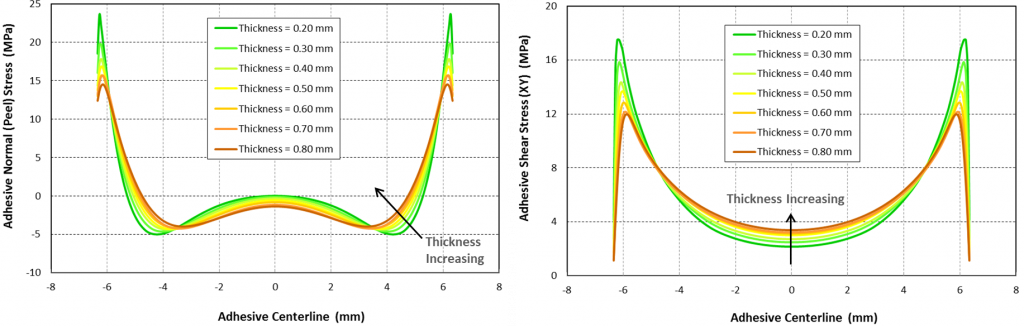
Figure 4: Peel and shear stress variation along bond line with bond thickness variation. Applied load is 1905 N (Unit load, F/L=75 N/mm) and thickness of bonding is 0.50 mm
The joint strength is plotted in figure 5. It shows both substrate and adhesive failure. As discussed above, the cohesive bond strength is calculated at the load where the adhesive Von Mises stress levels off as shown in figure 5. The failure point for substrate is taken where the substrate strain reaches 0.1 mm/mm. Based on this criteria, adhesive failure limit drops slightly as bond thickness goes up. Same is true for the aluminum substrate failure limit, although it fails at a much higher load. Figure 4 (right side chart) shows adhesive stress at failure for various bond thicknesses. Note, that failure point can be identified where the stress levels off.
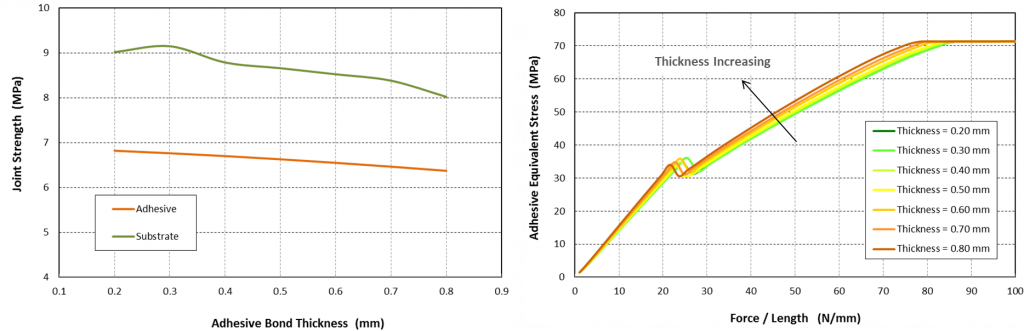
Figure 5: Joint Strength vs Adhesive Thickness. Both adhesive and substrate failure points are plotted. Figure on the right shows adhesive stress at failure for various bond thicknesses.
Effect of Adhesive Material Ductility
The effect of adhesive material ductility is studied next. As shown in figure 6, the original Araldite Epoxy AV119 model is modified to increase ductility. The bond thickness is held constant at 0.5mm. The results are shown in figure 7. Both peel and shear stress reduce with increasing adhesive ductility. Joint strength increases with increasing ductility as shown in figure 8. Once again, note that joint strength is determined by the load at which cohesive (or adhesive) failure occurs as shown on the right chart in figure 8.
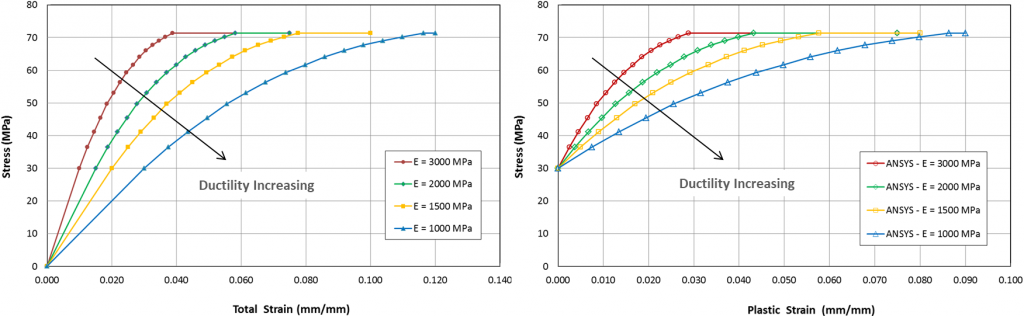
Figure 6: Study of varying adhesive ductility. Joint Strength vs Adhesive Thickness. Actual material modulus is modified to represent different material ductility.
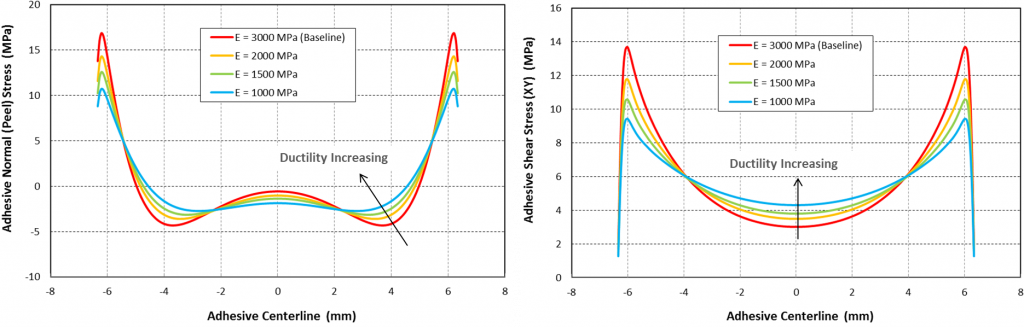
Figure 7: Both peel and shear stress reduce with increasing adhesive ductility. In this study the bond thickness is fixed at 0.5mm
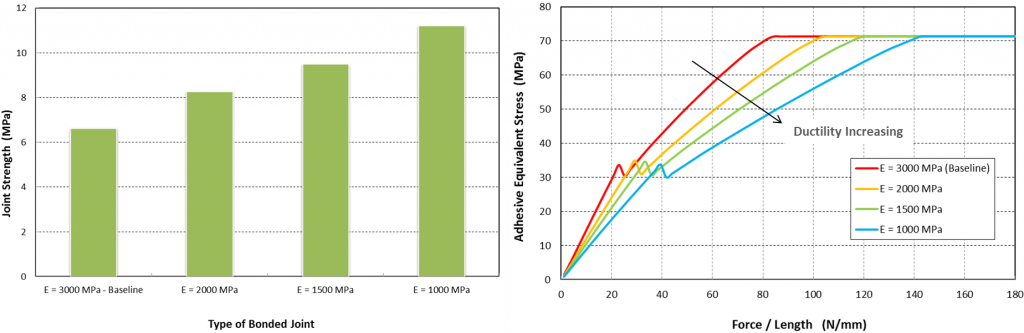
Figure 8: Joint Strength vs adhesive ductility. Joint strength increases with increasing ductility.
Effect of Edge Fillet
Finally, the effect of bond edge fillet is studied as shown in figure 9. Edge fillets in bonded joints are known to increase joint strength so it is important to study its impact.
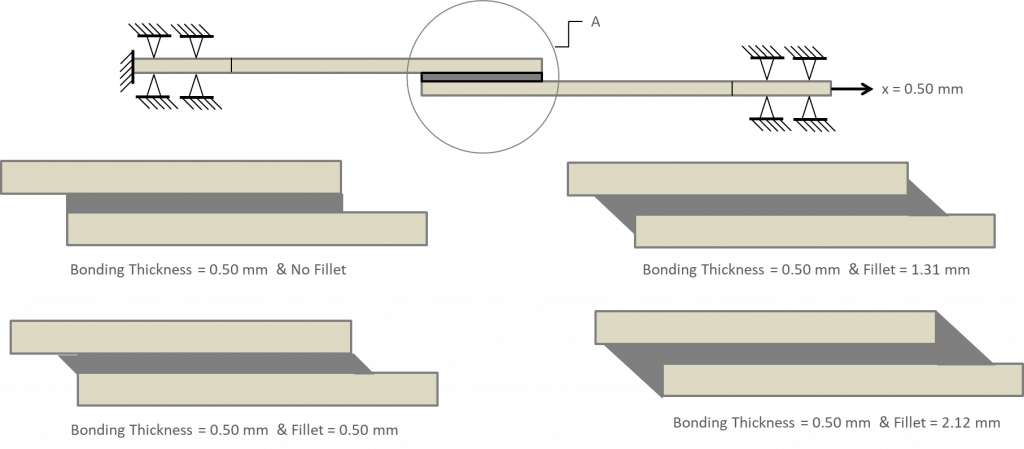
Figure 9: Study of fillet edge effects. Note the baseline case is 0.5mm and no edge fillet. This is compared with four different edge fillet sizes as shown while keeping the bond thickness fixed at 0.5mm.
Note the baseline case is 0.5mm and no edge fillet. This is compared with four different edge fillet sizes as shown while keeping the bond thickness fixed at 0.5mm. The results are shown in figure 10. Both peel and shear stress peaks forming around the edges of the bonding region reduce with increased size of end fillets of 1.31 and 2.12 mm while the change is insignificant for the fillet size of 0.50 mm compared to the no fillet case. So having larger edge fillets increases the joint strength and provides more uniform peel and shear stress distribution along the bonding centerline. The joint strength is shown in figure 11. Note the diminishing effect of fillet size increase on joint strength. The chart on the right shows adhesive stress at failure for the various edge fillet sizes.
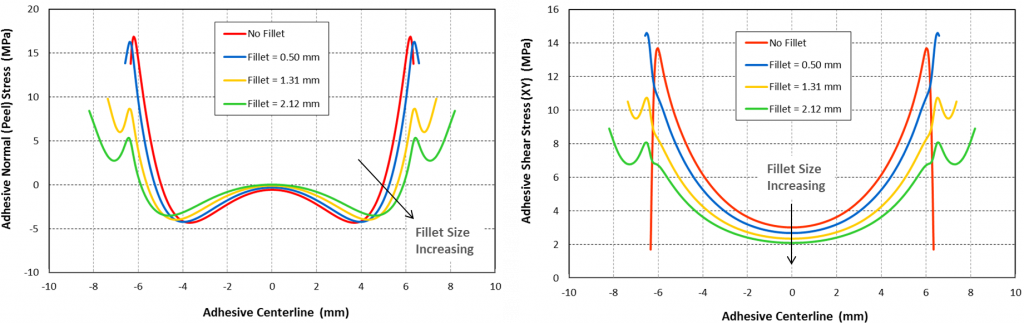
Figure 10: Adhesive peel and shear stress along bond line for different fillet sizes. The baseline case is no fillet.

Figure 11: Joint Strength increases with edge fillet length. Figure on the right shows adhesive stress at failure for various edge fillet sizes.
if you have questions or need help with mechanical engineering projects, please reach out to me at zaeem@endeavos.com

One Comment
Good afternoon! Thanks for useful tutorial. However, when I try to simulate SLJ test during the traction separation law the cohesive elements in my model are distorting. Could you please tell me the possible reason of that?